The solar activity follows a cycle of about 11 years that has been discovered by the german amateur astronomer Heinrich Schwabe. The solar cycles are numbered since the maximum of 1761. The cycle 24 started in december 2008 and its maximum is predicted in 2013.
During a solar cycle, the following characteristics evolve:
Unless otherwize stated, the data presented here below are from the Space Weather Prediction Center (SWPC): ![]() and the Solar Influences Data Analysis Center (SIDC) located in Belgium:
and the Solar Influences Data Analysis Center (SIDC) located in Belgium: ![]()
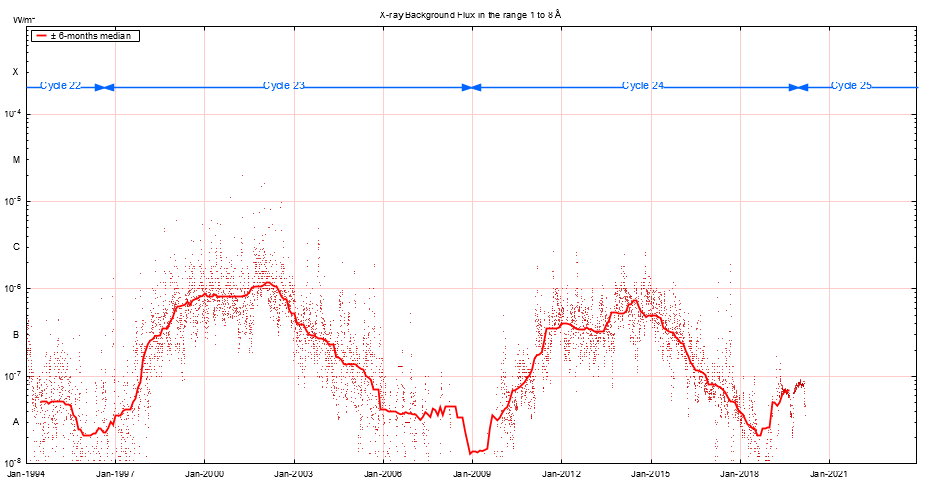
The X-ray background flux is a daily average of the X-ray flux measured in the 1 to 8 Å range by the GOES satellites. This averaging is centered on the midday and intends to reduce the effects of flares.

Last Update: 01 Jan 2024
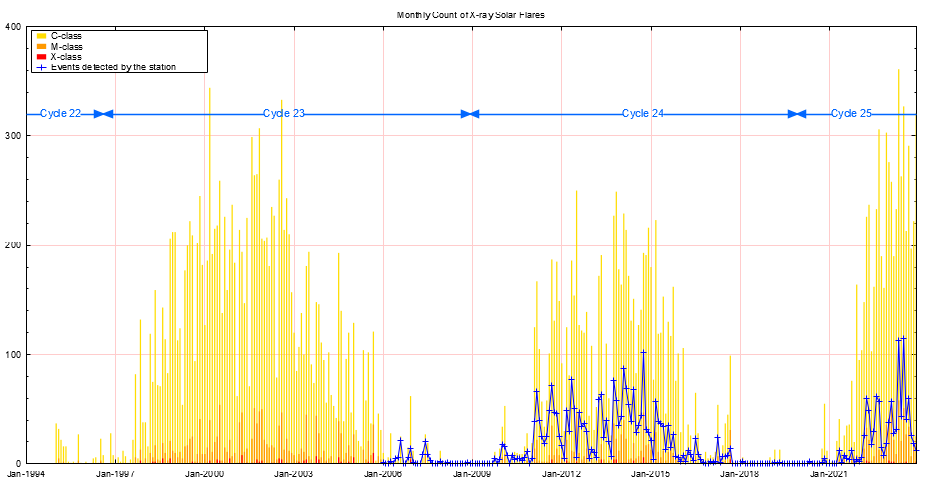
This plot shows the evolution of the X-ray background flux since 1994:The X-ray solar flares are classified according to their X-ray brightness in the wavelength range 1 to 8 Å. This brightness is measured as the peak intensity of the burst by the GOES satellites.

Last Update: 01 Jan 2024
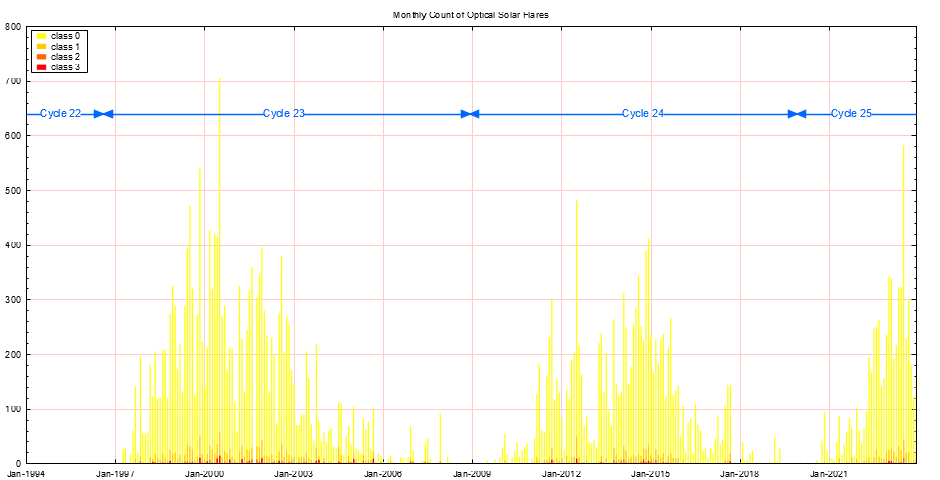
This plot shows the monthly count of X-ray flares since 1995:The optical solar flares are classified according to their solid angle at the time of maximum brightness in H-alpha (at the wavelength of 656.3 nm).
One square degree corresponds to an area of 1.214·104 km² at the Sun's surface. That corresponds to 48.5 millionths of the visible solar hemisphere.
The class is usually followed by a brightness qualifier F (Faint), N (Normal), or B (Brilliant).

Last Update: 01 Jan 2024
This plot shows the monthly count of optical flares since 1995:
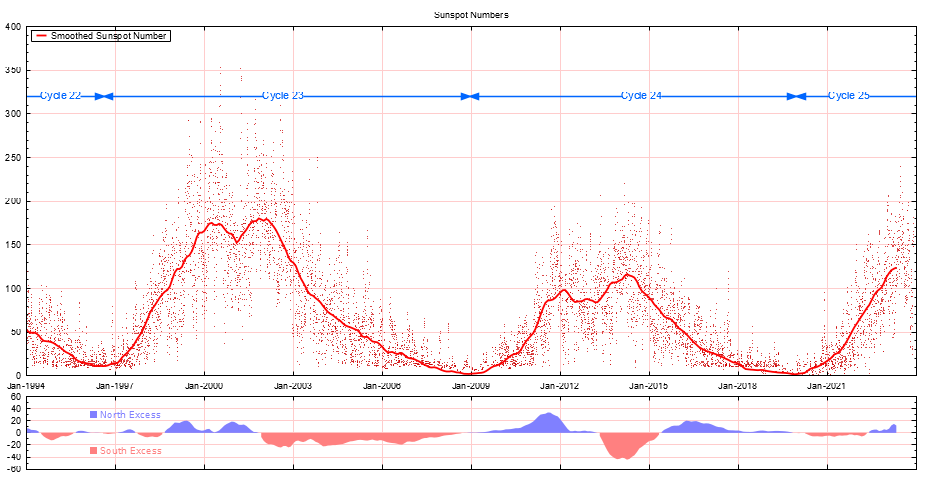
The evolution of the sunspots count is measured through the Sunspot Number. This index averages 190 during the solar maxima, with significant fluctations: 82 for cycles 5 and 6; 321 for cycle 19. During solar minima, the average value is 10.
Note that the Sunspot Number scale was revised on July 1st 2015. Data shown here are based on the new data series.

Last Update: 01 Jan 2024
This plot shows the Sunspot Number since 1994:|
SID monitoring station by Lionel LOUDET is licensed under a Creative Commons Attribution-NonCommercial-ShareAlike 3.0 Unported License. |
| Last Update: 28 Feb 2016 |
|
Apache/2.4.66 (Debian) |
|