VLF are known for their relatively high radio noise levels. We will see here what are the noise levels to expect in that frequency band.
Noise Sources
Radio noise limit the ability to detect weak signals. It consists of:
- natural noise sources:
- the atmospheric noise originates mainly from lightning activity. Lightning strike Earth 45 times per second on average, mainly around the equator. They generate huge quantities of interference that propagate around the Earth by ionospheric reflection.
- the cosmic (or galactic) noise originates mainly from the Sun, gases or star clusters.
- man-made sources, generated by man activities and usage of electrical or electronic devices. The level of this noise is highly dependent on the location: rural areas or business areas for instance, as well as on the time of the day.
Significant sources of VLF radio noise are low-cost switched-mode power supplies used in PCs and in fluorescent lamps.
Radio Noise Model
The radio noise is described in details in the ITU P.372 recommendation. This document gives median noise figures for natural and man-made sources.
The location affects the values in a range of ±7dB, excluding upper and lower deciles, and the time affects them in a range of [-5dB, +10dB], excluding upper and lower deciles.
Here are the plots provided by the ITU (you can enlarge them):
These plots provide the external noise figure
Fa for a short vertical monopole over a perfect ground as a function of the frequency. This parameter is defined by :
 (1)
(1)
with:
 (2)
(2)where:
- pn is the available noise power from an equivalent lossless antenna, in W
- k is the Boltzmann constant (1.38·10-23 J/K)
- T0 est reference temperature (288K)
- B is the receiver noise bandwidth, in Hz
In addition, the power given by an antenna is:
 (3)
(3)where:
- pn is the available noise power from an equivalent lossless antenna, in W
- En is the field strength, in V/m
- he is the effective height of the antenna, in m
- Rrad is the radiation resistance of the antenna, in Ω
For an ideal orientation of the antenna, the equation (3) become:
 (4)
(4)
For a loop, a ferrite or a half-wave dipole, the radiation resistance is given by:
 (5)
(5)where:
- Rrad is the radiation resistance of the antenna, in Ω
- Z0 is the impedance of free space (about 377Ω)
- he is the effective height of the antenna, in m
- λ is the wavelength, in m
From (2), (4) and (5), one can express the RMS value of the vertically polarized field strength, in V/m as:
 (6)
(6) (7)
(7)
The electric field noise spectral density is then:
 (8)
(8)Radio noise SPICE model
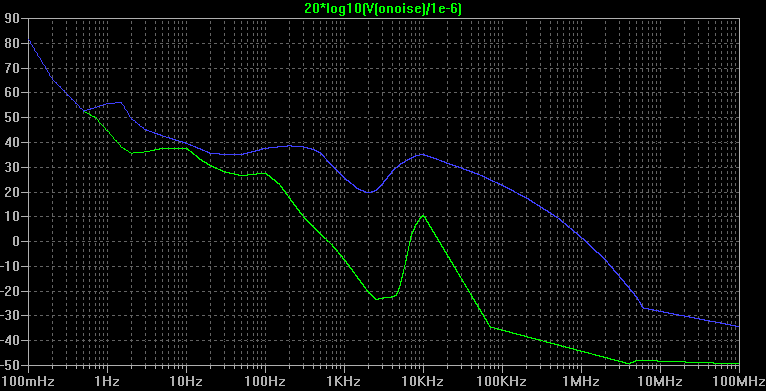
From the Fa values provided by the ITU and from equation (8), the following plot has been obtained with a SPICE simulation. The spectral density is expressed here in dB with a reference of 1µV·m-1/Hz½.
The blue plot is the median value of the maximum expected noise spectral density.
The green plot is the median value of the minimum expected noise spectral density.
As stated in introduction, the actual values can be several dB above or below those median values, depending on the location and the time of the day.
Those values are consistent with Maxwell et Stone measurements that are described in the following page:
http://www.vlf.it/naturalnoisefloor/naturalnoisefloor.htm.
 (1)
(1) (2)
(2) (3)
(3) (4)
(4) (5)
(5) (6)
(6) (7)
(7) (8)
(8)