

  SID Monitor Overview SID Monitor Overview Installation Installation Graphical User Interface Graphical User Interface Menubar Graph Area Date Tab Channels Tab GOES Tab Message Pane Status Bar Notification Icon Options Options Startup Options Data Acquisition Options Channels Options Database Options Forecast Options Graph Options Report and Alert Menubar Graph Area Date Tab Channels Tab GOES Tab Message Pane Status Bar Notification Icon Options Options Startup Options Data Acquisition Options Channels Options Database Options Forecast Options Graph Options Report and Alert Options Location Reapply Algorithm Parameters Generate Report View Report Sunrise and Sunset times calculator About information box FAQ FAQ Reports FAQ Databases FAQ Forecast Licence Credits Options Location Reapply Algorithm Parameters Generate Report View Report Sunrise and Sunset times calculator About information box FAQ FAQ Reports FAQ Databases FAQ Forecast Licence Credits |

|
|
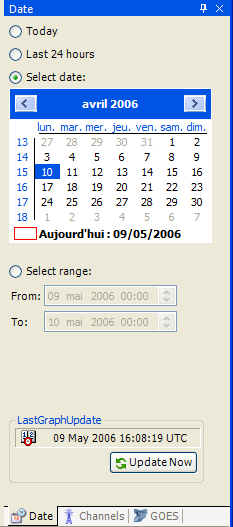
This tab selects the time range of the graph displayed in the graph area. Four options are available:
Missing data are indicated by red bands. This tab allows to show an history of 1 month of measurements.
The lower part of the tab contains the UTC time at which the graph currently
displayed has been generated. |

|
SID Monitoring Station de Lionel LOUDET est mis à disposition selon les termes de la licence Creative Commons Attribution - Pas d’Utilisation Commerciale - Partage dans les Mêmes Conditions 3.0 non transposé. |
|
| Dernière mise à jour : 31 Aug 2014 |
|
Apache/2.4.67 (Debian) |
|