
 Options Graph Options Graph
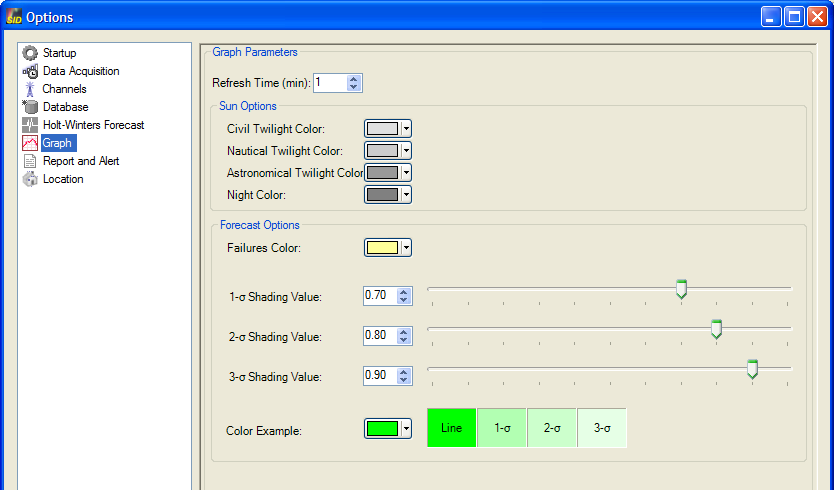
This panel sets the periodicity of the graph update. Automatic update of the graph is
enabled or disable through the Graph menu, the
status bar or the notification
icon contextual menu .
Sun Options
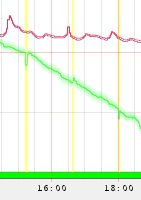
It is also used to choose the colors for the twilight and night bands that are displayed on
the plot. They can be used to correlate signal level sunrise and sunset patterns with
actual sunrise and sunset times. The channels pane is used
to enable the display of the bands.
Forecast Options
Parameters for the display of forecast algorithm results are available in this panel.
 |
The color of the failure marks can be choosen. These marks indicate when the algorithm has
detected an aberrant behavior. |
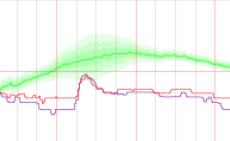 |
The color of the confidence bands calculated by the forecast algorithm can also be
selected. The color is obtained by a lightening of the corresponding channel line color.
Each band (1 σ, 2 σ, 3 σ) has its own fading parameter. The effect of the color fading
can be previewed for a selectable color. |
The channels pane is used to enable the display of the
failure marks and of the confidence bands.
More information on the forecast algorithm can be found here.
|


 SID Monitor Overview
 Graphical User Interface

