 Graph area Graph area
Plots are periodically generated if the graph automatic update is enable, either in the
graph menu, the status
bar or the notification icon.
Plot content can be adjusted through the date tab, the
channels tab and the
GOES tab.
Many parameters, such as line colors and refresh period, are defined in the options menu.
Mouse graph interaction
Zoom
Zoom in and zoom out capabilities are available through the mouse wheel.
Zooming in and out is limited to a factor of about 6 times.
The zoom ratio is shown (if different from 1.0) in the bottom-right of the viewing
area.
When the plot size fits entirely in the viewing area, it is not possible to zoom out any
further.
Pan
If the plot size exceeds the viewing area, the cursor changes to a hand
( ). It is then possible to pan the graph in any
direction by moving the mouse with the left button pressed. ). It is then possible to pan the graph in any
direction by moving the mouse with the left button pressed.
When the plot size fits entirely in the viewing area, the cursor has a cross shape
( ). ).
Right-clicking in the graph area opens a contextual menu. This menu allows to:
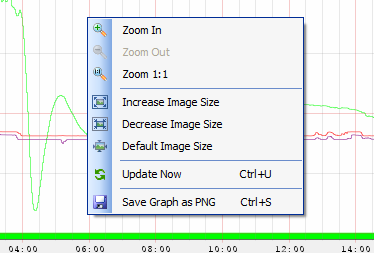
|
- Zoom in/out the image without modifying the image resolution:
 zoom in, zoom in,
 zoom out, zoom out,
 reset zoom factor to 1.0. reset zoom factor to 1.0.
Icons are grayed out if a zoom factor limit is exceeded.
- Change the image resolution:
 increase image size, increase image size,
 decrease image size, decrease image size,
 revert to default size. revert to default size.
Image resolution can be scaled up or down by a factor of about 4.
Icons are grayed out if an image size limit is exceeded.
-
 Updates the graph image. Updates the graph image.
-
 Save current graph as a PNG file. Save current graph as a PNG file.
Icon is grayed out if no image is displayed.
|
|


 SID Monitor Overview
 Graphical User Interface

