

  SID Monitor Overview SID Monitor Overview Installation Installation Graphical User Interface Graphical User Interface Menubar Graph Area Date Tab Channels Tab GOES Tab Message Pane Status Bar Notification Icon Options Options Startup Options Data Acquisition Options Channels Options Database Options Forecast Options Graph Options Report and Alert Menubar Graph Area Date Tab Channels Tab GOES Tab Message Pane Status Bar Notification Icon Options Options Startup Options Data Acquisition Options Channels Options Database Options Forecast Options Graph Options Report and Alert Options Location Reapply Algorithm Parameters Generate Report View Report Sunrise and Sunset times calculator About information box FAQ FAQ Reports FAQ Databases FAQ Forecast Licence Credits Options Location Reapply Algorithm Parameters Generate Report View Report Sunrise and Sunset times calculator About information box FAQ FAQ Reports FAQ Databases FAQ Forecast Licence Credits |

|
|
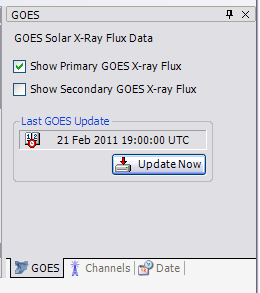
This tab selects the GOES data plotted in the graph displayed in the graph area.
GOES data are automatically downloaded from the internet. The values are provided by
the Space Environment Center of the National
Oceanic & Atmospheric Administration (NOAA). The plotted values correspond to the solar X-ray flux in the 1-8 Angstrom (0.1-0.8 nm) passband as measured by satellites GOES satellites.
The X-ray flux is measured in W/m�. The values are scaled to fit in the signal level
plot.
Flares above M1 (1�10-5 W/m�) should be detected by the monitoring station. � The following options are available:
The time of the last download of GOES data is indicated. It is possible to perform an immediate update of the information.
The lower part of the tab contains the UTC time at which the graph currently
displayed has been generated. |

|
SID monitoring station by Lionel LOUDET is licensed under a Creative Commons Attribution-NonCommercial-ShareAlike 3.0 Unported License. |
|
| Last Update: 31 Aug 2014 |
|
Apache/2.4.67 (Debian) |
|