|
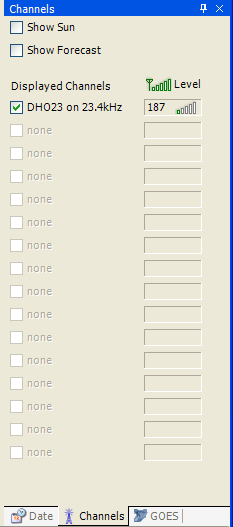
This tab selects the elements plotted in the graph displayed in the graph area.
The following options are available:
- "Show Sun" checkbox, to indicate whether or not sunrise/sunset and twilights times are displayed. Only the period of time between the sunrise and the sunset
patterns is usable for SID events detection.
- "Show Forecast" checkbox, to indicate whether or not aberrant behavior detection
algorithm confidence bounds are displayed. Detected failures (indicating a potential
event, provided the algorithm is correctly tuned) are indicated by vertical bands.
- "Displayed channels": the user can select which channels are displayed. Up to 16
ADC channels can be monitored. The real time value of the signal level is also
indicated. It is expressed in mV.
Missing data are indicated by red bands.
The lower part of the tab contains the UTC time at which the graph currently
displayed has been generated.
A button is available to refresh immediatly the graph.
Note: one can also use the Graph
menu, the date tab or the GOES tab.
|

