 FAQ – Forecast
RRDtool includes:
- the Holt-Winters forecasting algorithm that is used to adaptely predict future values;
- a measure of the deviation between predicted and observed values, and definition of
confidence bands;
- aberrant behavior detection mechanism that flags observations that are too deviant from
the predicted values.
Forecasting
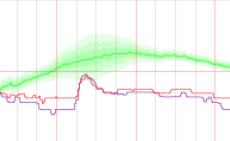
The prediction is based on the Holt-Winters forecasting algorithm. It adaptively predicts
future observations in a time series.
This forecast is the sum of three components:
- a baseline (or intercept),
- a linear trend over time (or slope),
- a seasonal coefficient (a periodic effect, such as a daily cycle in our case).
There is one seasonal coefficient for each time point in the period (cycle). After a value
is observed, each of these components is updated via exponential smoothing. This means that
the algorithm "learns" from past values and uses them to predict the future.
The rate of adaptation is governed by 3 parameters:
-
alpha: α is the adaption parameter of the intercept (or baseline) coefficient in
the Holt-Winters forecasting algorithm. α must lie between 0 and 1. A value closer to 1
means that more recent observations carry greater weight in predicting the baseline
component of the forecast. A value closer to 0 means that past history carries greater
weight in predicting the baseline component.
-
beta: β is the adaption parameter of the slope (or linear trend) coefficient in
the Holt-Winters forecasting algorithm. β must lie between 0 and 1 and plays the same
role as α with respect to the predicted linear trend.
-
gamma seasonal: γ is the adaption parameter of the seasonal coefficients in the
Holt-Winters forecasting algorithm. It must lie between 0 and 1. Note that because there
is one seasonal coefficient for each time point during the seasonal cycle, the adaptation
rate is much slower than the baseline. Each seasonal coefficient is only updated (or
adapts) when the observed value occurs at the offset in the seasonal cycle corresponding
to that coefficient.
The closer the parameters are from 1, the faster the algorithm adapts.
Confidence Bands

The measure of deviation is a seasonal weighted absolute deviation. The term "seasonal"
means deviation is measured separately for each time point in the seasonal cycle. As with
Holt-Winters forecasting, deviation is predicted using the measure computed from past
values (but only at that point in the seasonal cycle). After the value is observed, the
algorithm learns from the observed value via exponential smoothing. Confidence bands for
the observed time series are generated by scaling the sequence of predicted deviation
values.
gamma seasonal deviation is the adaption parameter in the exponential smoothing
update of the seasonal deviations. It must lie between 0 and 1. The closer it is from 1,
the faster the algorithm adapts. Note that because there is one seasonal deviation for each
time point during the seasonal cycle, the adaptation rate is much slower than the baseline.
Aberrant-behavior detection

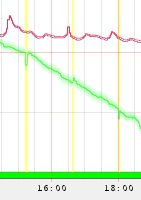
Aberrant-behavior (a potential SID event) is reported whenever the number of violations
(observations that fall outside the confidence bands) exceeds a specified threshold within
a specified moving temporal window.
The following parameters affect the detection mechanism:
-
upper bound or deltapos: δ+ alters the deviation scaling factor
for the upper bound of the confidence band used internally to detect a violations. The
default value is 2.
-
lower bound or deltaneg: δ– alters the deviation scaling factor for the
lower bound of the confidence band used internally to detect a violations. The default
value is 2.
-
threshold is the minimum number of violations (observed values outside the
confidence bounds) within a window that constitutes a failure. The default value is 7.
-
window length is the number of time points in the window. Specify an integer
greater than or equal to the threshold and less than or equal to 28. The time interval
this window represents depends on the acquisition update time. The default value is 9.
Note: This information is based on RRDTool
documentation and on the paper "Aberrant Behavior Detection in Time Series for Network
Monitoring" by Jake D. Brutlag, Proceedings of the 14th Systems Administration
Conference (LISA 2000), New Orleans, Louisiana, USA, December 3-8, 2000.
