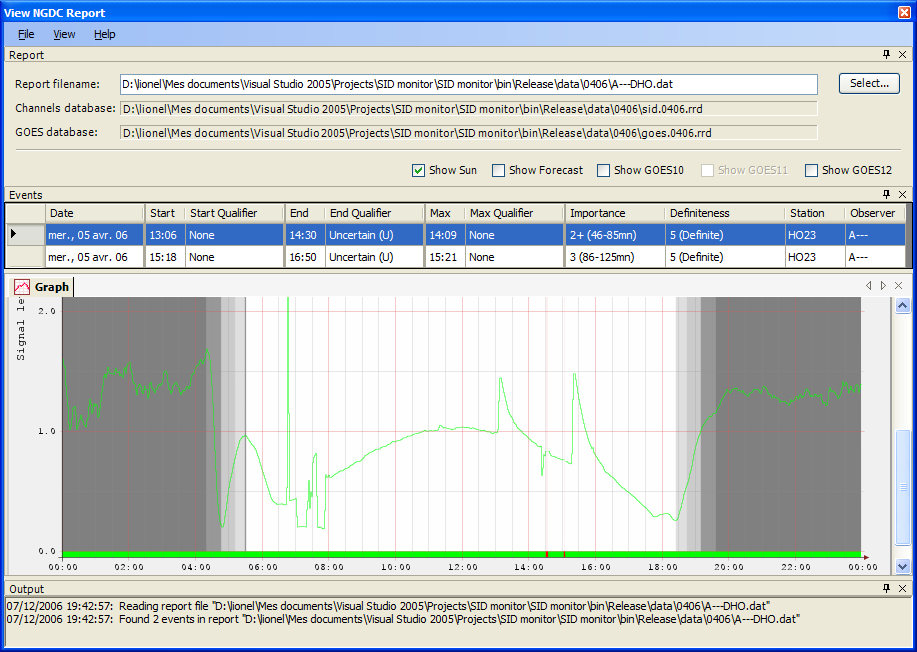
 View Report View Report
The View Report toolbox is opened through the "Reports/View�Existing Report" menu.

Report Selection
The report file selected in the "Report filename" field is processed. By default, report
file extension is expected to be .dat.
The events listed contained in the report file are displayed in the Events table.
More information on the format of the report file and on the definition on the fields is
available in the Reports FAQ.
If the associated channels and GOES database are present in the same directory as the
selected report, they are indicated in the "Channels database" and "GOES database"
fields.
The databases are searched in the following locations:
- first from the "Database:" and the "GOES Database" fields of the header of the report
file;
- then from the filenames
sid.MMYY.rrd and goes.MMYY.rrd, where
MM and YY are respectively the month and the year of the report;
- finally from the filenames
sid.rrd and goes.rrd.
If those filenames are found, the graph area is used to display the graph of the day that
corresponds to an event selected from the table.
Options "Show Sun", "Show Forecast", "Show Primary GOES" and "Show Secondary GOES" are available and have
the same affect as in the main window graph area.
The graph area offers the same functionalities (zoom and pan) as the main window graph
area.
The Output pane displays specific messages indicating the status of the operations. �
Menubar
The menubar contains the following elements:
|
